 |
| Note: to access the interactive version, go to: http://www.census.gov/dataviz/visualizations/stem/stem-html/ |
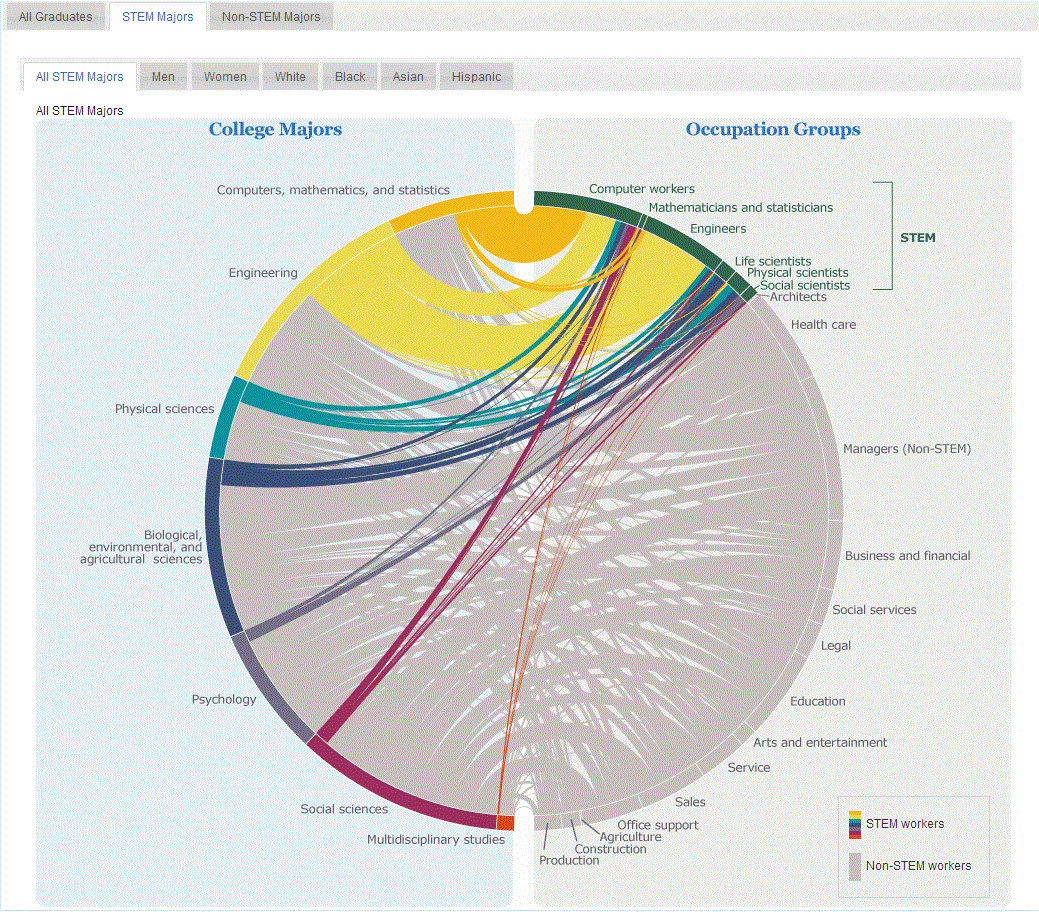
By hovering over a college major on the STEM Majors or Non-STEM Majors tab, you can see which occupations these graduates work in. You can also hover over an occupation to see which majors they hire from. These graphics show that only a minority of STEM majors are employed in STEM.
This visualization also lets you look at college major and employment patterns by sex, race, and Hispanic origin. It allows you to compare the relative size of each college major and occupation, as well as the proportion who are employed in STEM by these demographic characteristics. Comparing the graphics for men and women who are STEM majors, for example, we see that men are more likely to major in engineering and are more likely to be employed in STEM occupations."
 |
| By gender (males, left; females, right) |
 |
| By race (clockwise from top left: White, Black, Hispanic, Asian) |
Read more:
http://www.census.gov/dataviz/visualizations/stem/stem-html/
TeachingwithData.org resources:
Gender in STEM Education: A Data-Driven Learning Guide (http://www.teachingwithdata.org/resource/3446)


No comments :
Post a Comment