
 The Census Bureau's weekly data visualization shows the change in population density by county of the United States each decade from 1920-1950. In the 1920s, predominantly rural counties in the East saw declining population densities due to a trend of migration to cities. The 1930s saw the Great Plains decline in population while rural areas in the East became more densely populated again. As World War II ended, the United States saw increased geographic mobility, which led to 21.5 percent of civilians moving to different counties or states between 1940 and 1947. The map shows that urban and populated Northeast and Midwest counties saw the largest growth in the 1940s, while predominantly rural counties in the Great Plains and the South continued to see declining population density.
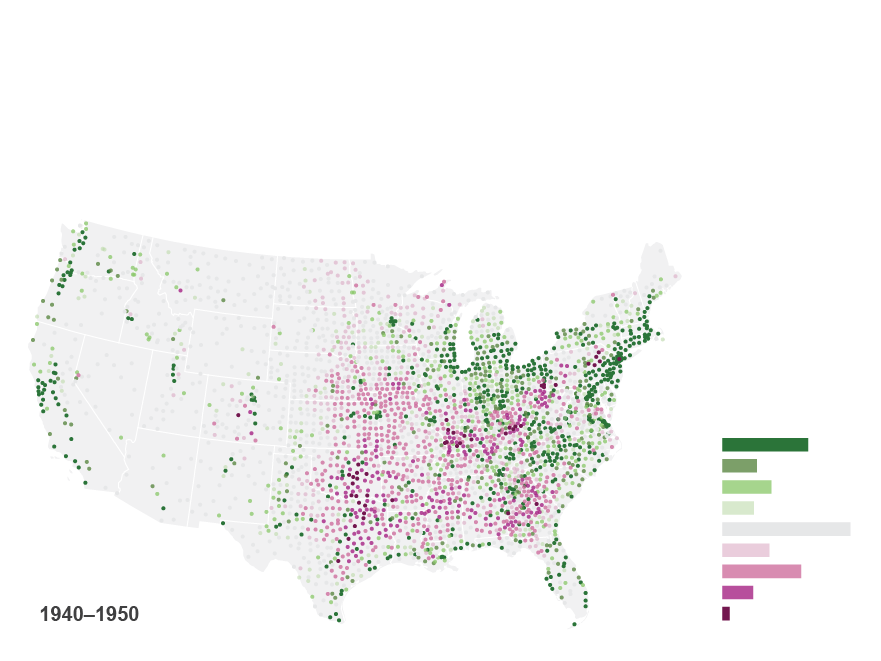
Population Density in the Early 20th Century
The Census Bureau's weekly data visualization shows the change in population density by county of the United States each decade from 1920-1950. In the 1920s, predominantly rural counties in the East saw declining population densities due to a trend of migration to cities. The 1930s saw the Great Plains decline in population while rural areas in the East became more densely populated again. As World War II ended, the United States saw increased geographic mobility, which led to 21.5 percent of civilians moving to different counties or states between 1940 and 1947. The map shows that urban and populated Northeast and Midwest counties saw the largest growth in the 1940s, while predominantly rural counties in the Great Plains and the South continued to see declining population density.
Popular Posts
-
 A study recently featured in the Journal of Comparative Economics examines income inequality in urban China. Capital income increased d...
 -
 A recent post on the Economist’s Graphic Detail blog includes a global map of cigarette smokers in 2010, as reported by the American Cance...
 -
 The month of March signaled the beginning of National Women’s History Month, as well as the annual Oscar Awards ceremony, which was held on...
 -
 According to the Washington Post, since 2009, the unemployment rate in the United States has dropped by 50% . The traditional...
 -
If you’ve hit the point in the semester where your classes have fallen into routines and you’d like to spice things up a bit, this webinar i...
No comments :
Post a Comment